How Proof’s Layered Intelligence Model Outperforms Passive Fraud Detection 600 - 1,300% With Minimal Friction

Updated July 15, 2026
As fraudsters adopt more targeted and sophisticated attacks, static defenses like multi-factor authentication (MFA) and knowledge-based authentication (KBA) are proving less effective, leaving a lot of fraud undetected. We believe that the future of fraud detection requires a comprehensive approach. That’s why we’ve built a layered intelligence model that integrates passive signals, active checks, and collective telemetry from the Identity Authorization Network (IAN) to achieve superior performance. Learn how Proof’s model outperforms passive fraud detection by 600 - 1,300% without adding more friction for users.
Key takeaways
- Passive-only fraud models leave significant fraud undetected. At a 2.25% intervention rate, a leading industry benchmark model failed to detect 1.72 basis points of fraudulent transactions — fraud that slipped through entirely.
- Proof's Defend Risk Engine detected 630% more fraud at the "High" risk threshold (0.25% intervention rate) compared to the industry benchmark, and 175% more at the "Medium" threshold — translating to up to 6× more fraud caught at equivalent intervention rates.
- Multi-signal detection is 13× more efficient. To match Defend's recall of 48% at a 0.25% intervention rate, the industry benchmark model would have needed to flag 3.35% of all transactions — creating 13× more operational burden.
- Layered intelligence drives undetected fraud below 1 basis point (less than 1 in 10,000 transactions) at a 2.25% intervention rate, a critical threshold for high-value workflows like real estate eClosings, mortgage applications, and bank account openings.
- Stronger fraud controls do not require sacrificing user experience. Proof's internal data shows user completion rates above 90% and NPS consistently averaging 70–80, even with advanced fraud controls active.
- Network-level intelligence compounds over time. The Identity Authorization Network (IAN) creates a fraud linkage effect — confirmed fraud detected in one area propagates across the network, protecting all participants.
1. The Industry Standard: Passive-Only Fraud Modeling
In the world of digital identity verification and fraud prevention, industry standard modeling practices generally center around leveraging "passive signals" which are data points like email, phone number, device details, and user history to minimize customer friction. These approaches enable scalable fraud screening with little disruption to user, justifying their wide adoption across financial services, e-commerce, and SaaS.
However, as fraudsters adapt to these screening methods and target systems with increasingly sophisticated tactics, relying solely on passive signals presents serious limitations. A leading fraud-screening provider claims that their email risk score product captured nearly 68% of fraud at a 5% intervention rate with a 6:1 false positive ratio; however, these numbers imply a 1.05% total fraud rate (105 basis points), and their solution leaves over 33.6 basis points of fraud undetected.
Additionally, targeted and stateless identity intervention methods are increasingly susceptible to exploitation by sophisticated fraud actors. For example, recent reports show that multi-factor authentication (MFA), a widely used verification solution, only blocks 30% to 50% of fraud attempts, which is significantly lower than the 99.9% efficacy claimed by some vendors such as Microsoft. (1, 2, 3) Likewise, the widespread availability of personal information on social media and through dark web data brokers has made knowledge-based authentication (KBA) more vulnerable than ever, reducing its effectiveness as a security measure.
2. Proof's Layered Intelligence Model: Passive + Active Signals and Identity Network enablement for Superior Performance
Proof’s layered model builds upon industry standards — integrating curated passive signals, active user identity verification checks, human-in-the-loop reviews (e.g., notaries as authenticators), and Identity Authorization Network (IAN) enablement. Combining these layers results in less than 0.01% (or 1 basis point)of undetected fraud at a 2.25% intervention rate, with up to 6x improvement over a leading industry competitor by detection performance and up to 13x improvement by intervention efficiency.
Key Innovations:
- Combining passive, active, and Proof’s IAN (consortium) signals:
- Passive signals (email, phone, device, address, etc.)
- Active signals (KBA, document verification, selfie-verification, and human-in-the-loop meeting support)
- Rich, manual training data:
- All fraud cases are verified in-house
- Proprietary evidence and strong labeling, power robust model performance
- Multiple feedback loops:
- Continuous system monitoring
- Notaries and direct customer feedback
- Network-level fraud linkage identification (IAN effect)
- Industry diversity in application:
- Proven across domains: financial aid (FAFSA), bank account applications, real estate eClosings, landlord impersonations, deepfake scenarios, etc.
3. Introducing Performance Analysis Terms
To compare fraud solutions, observers must adopt performance evaluation metrics that align with the operational objective of preventing fraud:
- Recall (fraud detection rate): Percent (%) of total fraudulent transactions identified by the model.
- Intervention rate: Percent (%) of transactions flagged for review in descending order by model fraud likelihood score.
- Lift: The ratio of recall performance between competing models (e.g., Proof vs industry benchmark) at a fixed intervention rate. E.g. how much more fraud is detected, comparing a challenger and a benchmark model.
- Efficiency lift: The ratio of intervention rate performance between competing models (e.g., Proof vs industry benchmark) at a fixed recall. E.g. how much less you need to intervene to obtain the same detection rate, comparing challenger and benchmark models.
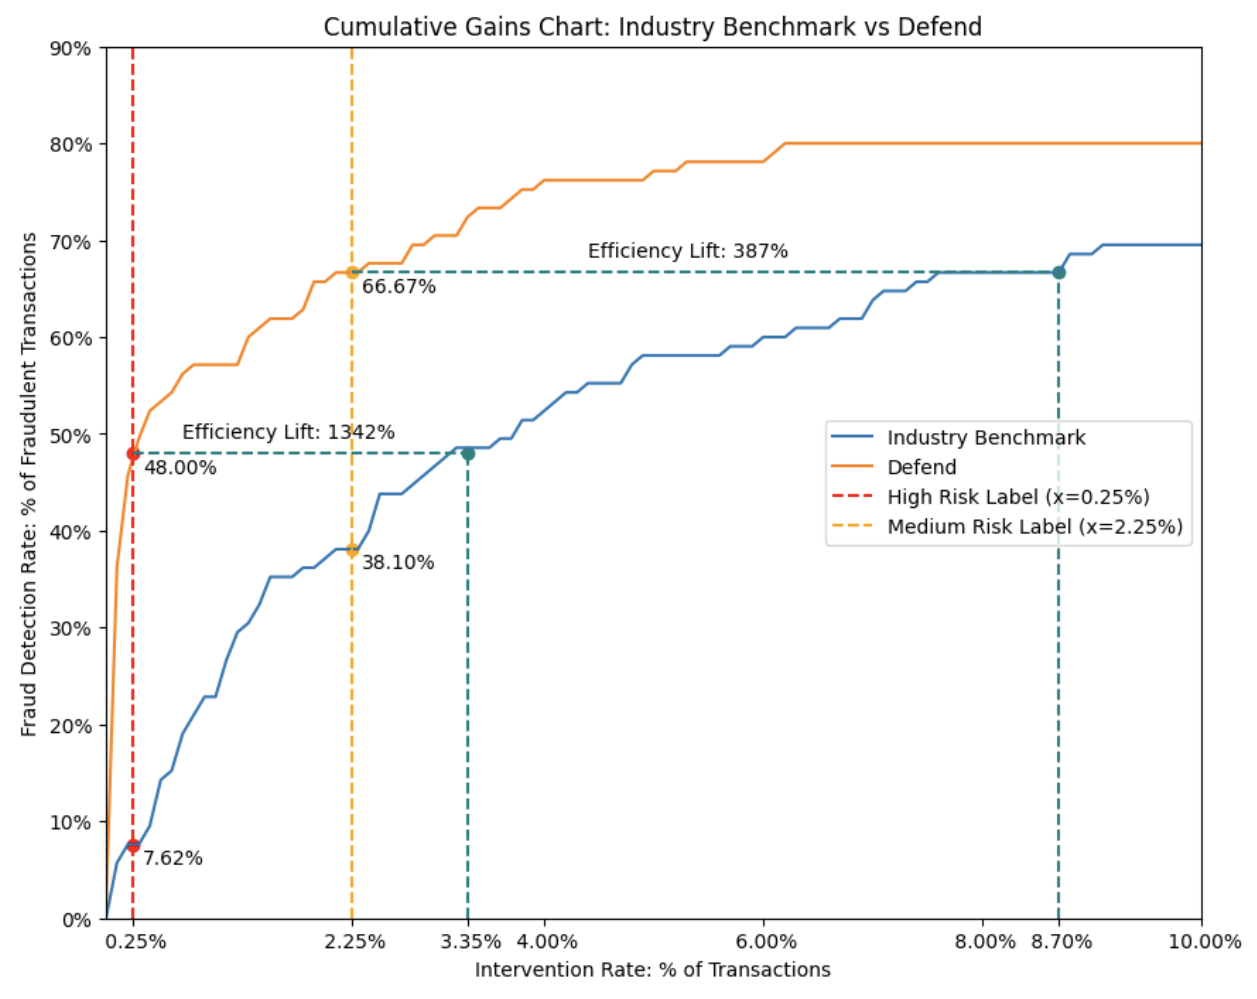
- Cumulative gains chart (recall vs. intervention): Visualizes how recall improves as more transactions are flagged, providing a clear picture of model discrimination.
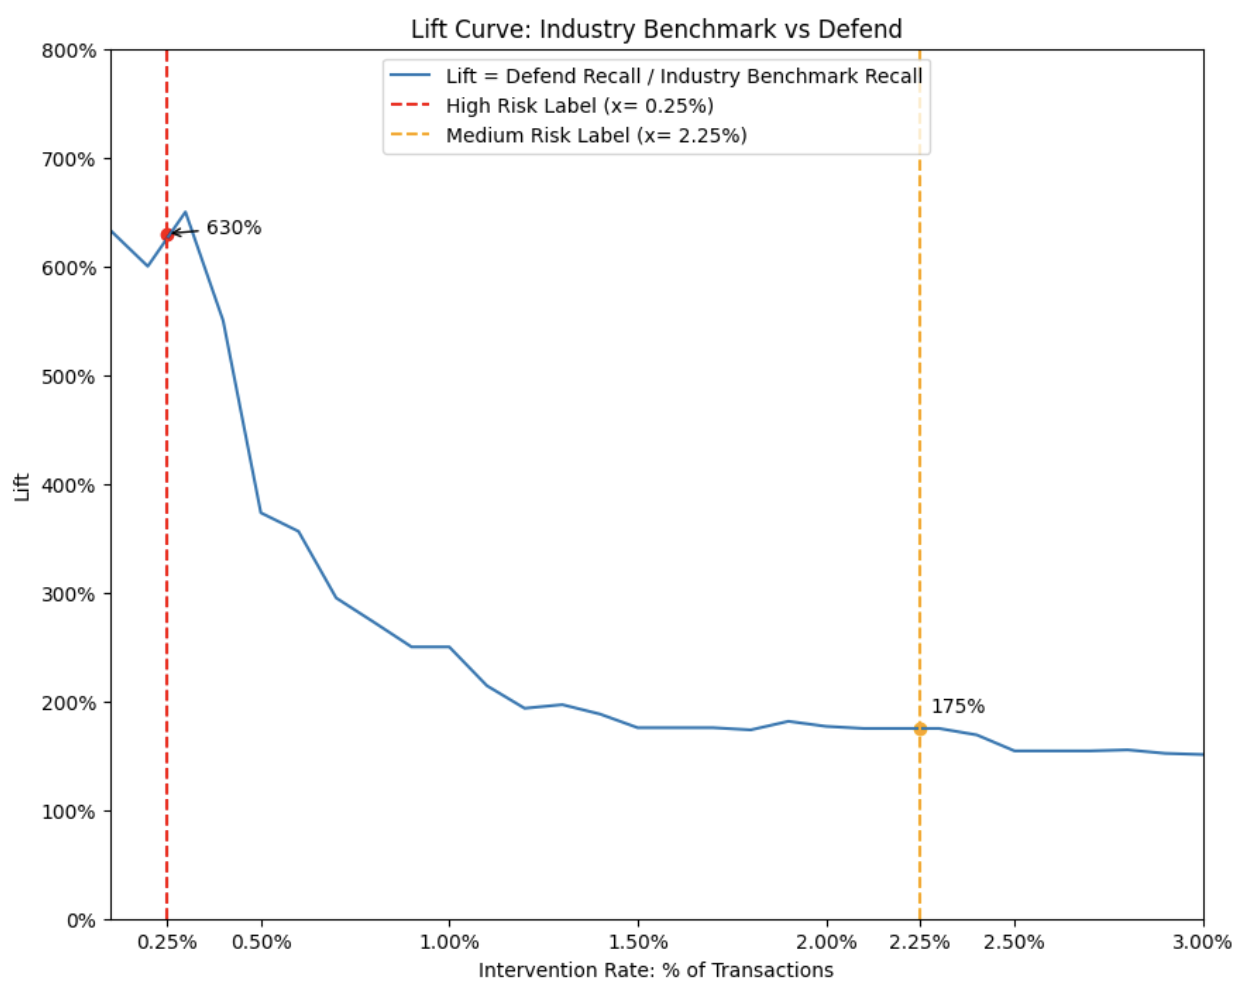
- Lift curve: Visualizes lift at various intervention rates, highlighting fraud detection performance advantage.
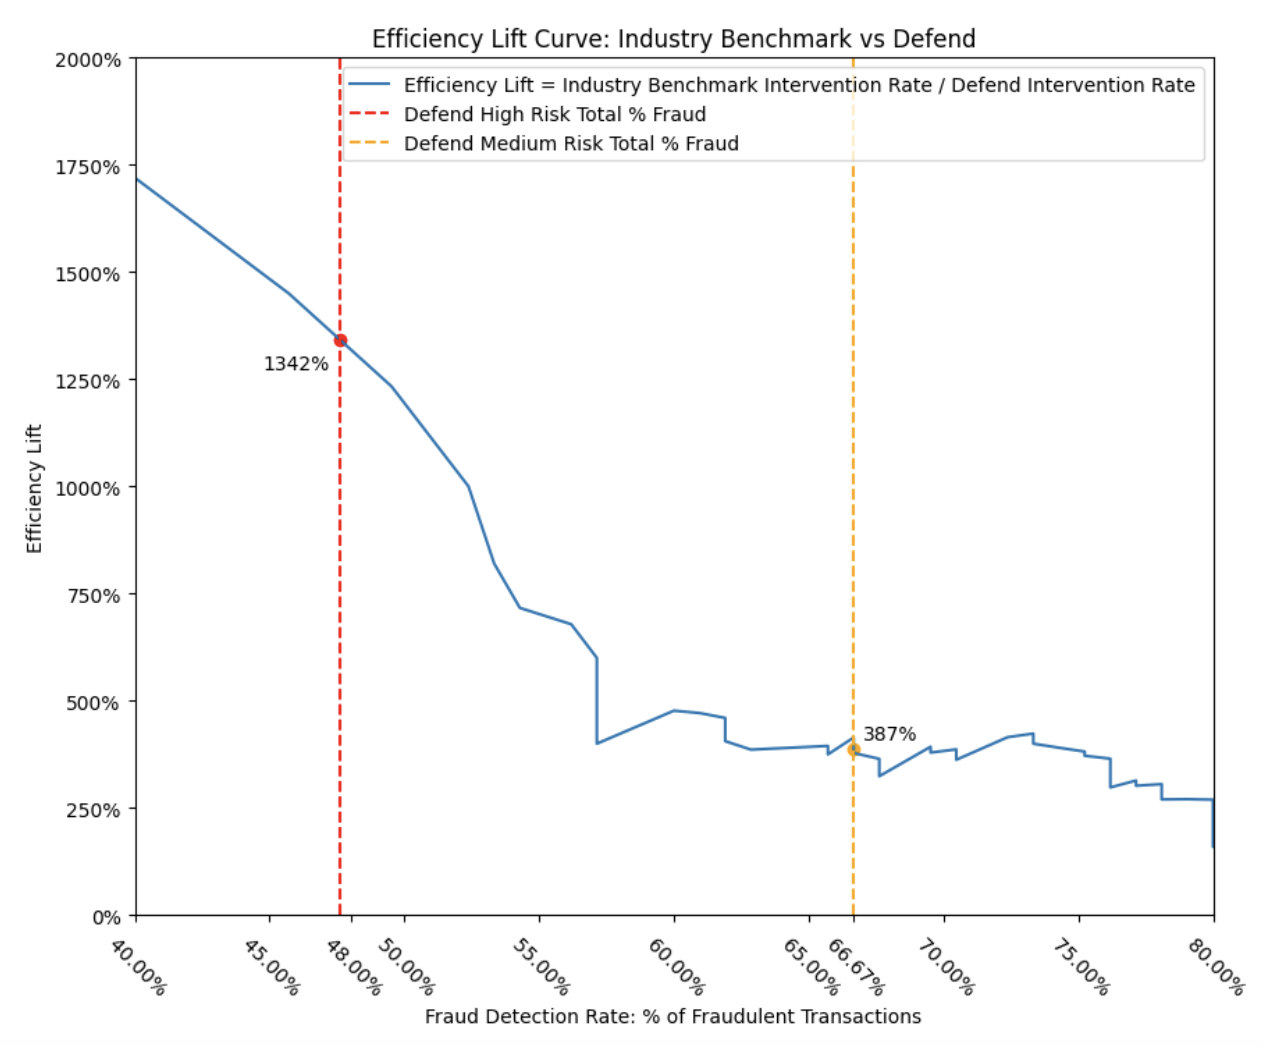
- Efficiency lift curve: Visualizes efficiency lift at various recall (i.e. fraud detection rates), intervention rate efficiency advantage.
4. Methodology
Modeling approach: supervised machine learning for fraud classification
Our team used fully labeled (fraudulent + non-fraudulent) cases where available, supplemented by positive-unlabeled (PU) learning to handle ambiguous or incomplete ground-truth outcomes common in real-world fraud and abuse detection datasets.
Performance simulation: K-fold cross-validation by user/fraud ring ID:
We employed K-fold cross-validation by repeatedly partitioning the data into K distinct subsets, with each fold serving as the test set while the remaining folds were used for model training. This methodology enables a robust, backfilled simulation of model performance on truly unseen transactions.
To further strengthen our analysis and prevent data leakage, we constructed folds based on user and fraud ring IDs. This meant all transactions associated with a given user or fraud ring were placed entirely within a single fold, either in training or testing, but never split between both. By ensuring that no transactions from the same entity appeared in both training and test sets, we eliminated information leakage and prevented the model from benefiting from prior exposure to related data. As a result, our evaluation metrics provided an accurate, unbiased measure of real-world model performance.
Business-relevant evaluation: policy evaluation tables
We assigned "High" and "Medium" risk labels to transactions using model score percentiles, applying predetermined policy thresholds that corresponded to 0.25% and 2.25% cumulative intervention rates, respectively. For each risk category, we aggregated and summarized the model’s performance metrics relative to the Cumulative Gains Chart, presenting the results in a clear policy evaluation table. This approach provided actionable insights into the model’s effectiveness at different intervention levels.
5. Performance Takeaways (Industry Benchmark vs. Proof Model)
A risk score from the industry benchmark fraud model was available for a subset of Proof’s transactions over the past year. To enable an accurate comparison, we filtered the Defend risk engine’s simulation results to this same subset of transactions, including both fraudulent and non-fraudulent cases. Within this subset, the prevalence of fraudulent transactions was 2.78 basis points (BPS)*, meaning nearly 3 out of every 10,000 transactions were fraudulent.
*Note: 2.78 BPS is an artificially high rate of fraud—the Industry Benchmark fraud model was strategically deployed on a high-risk population of transactions, thus inflating the fraud BPS in the dataset
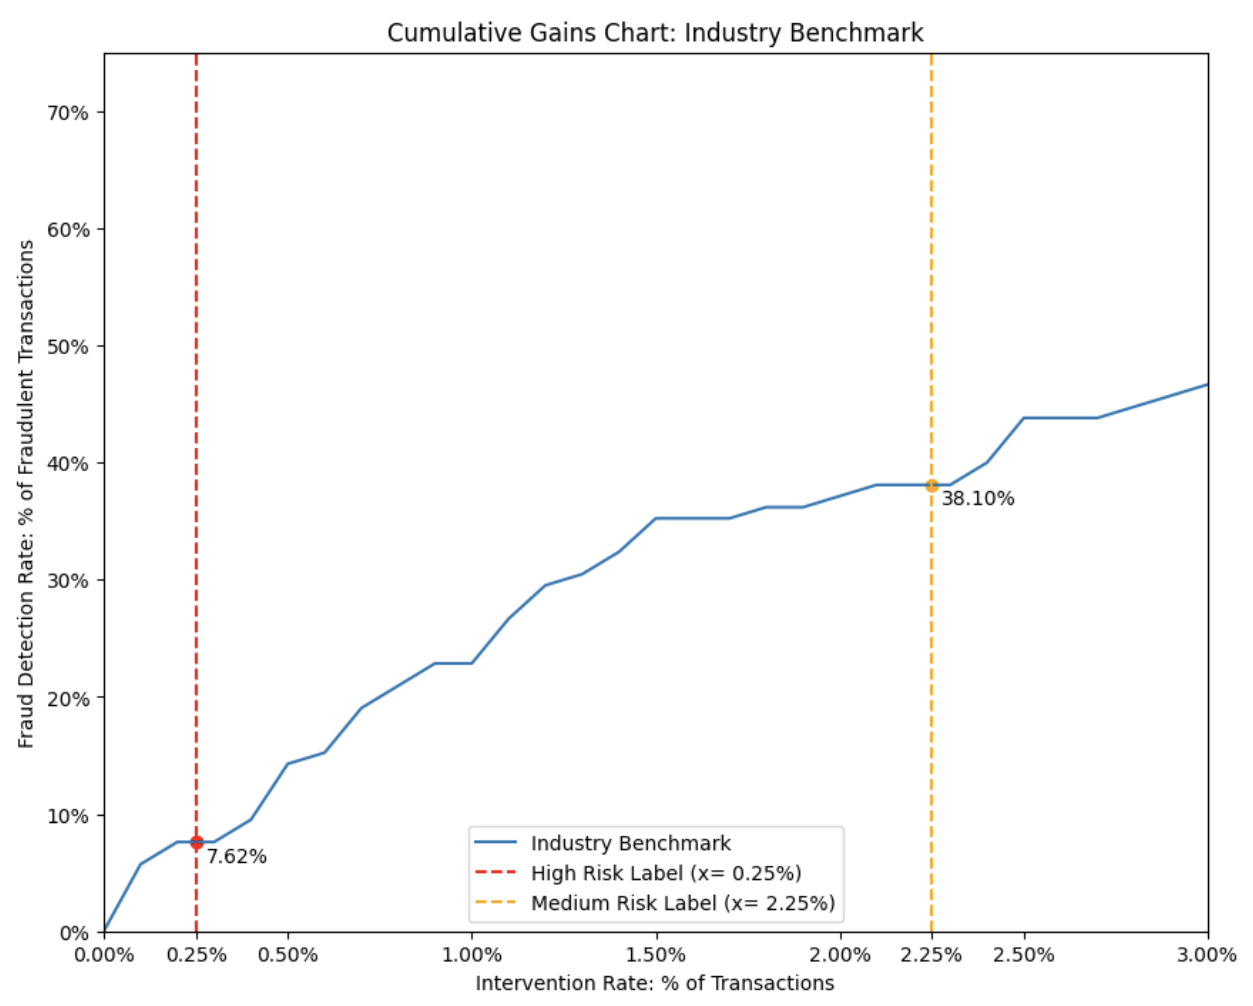
A. Industry benchmark performance
Industry Benchmark Policy Evaluation Table
Our analysis indicates that the industry benchmark fraud detection model identified nearly 8% of known fraudulent transactions within the Proof IAN dataset over the past year at the 0.25% intervention rate (i.e. transactions classified as “High” risk). At a cumulative intervention rate of 2.25% (encompassing both “High” and “Medium” risk categories), the industry benchmark model detected close to 40% of fraudulent transactions.
Notably, at a 2.25% cumulative intervention rate, the industry benchmark model failed to detect 1.72 BPS of fraudulent transactions, leaving these as undetected fraud in the dataset.
B. Fraud detection performance and lift
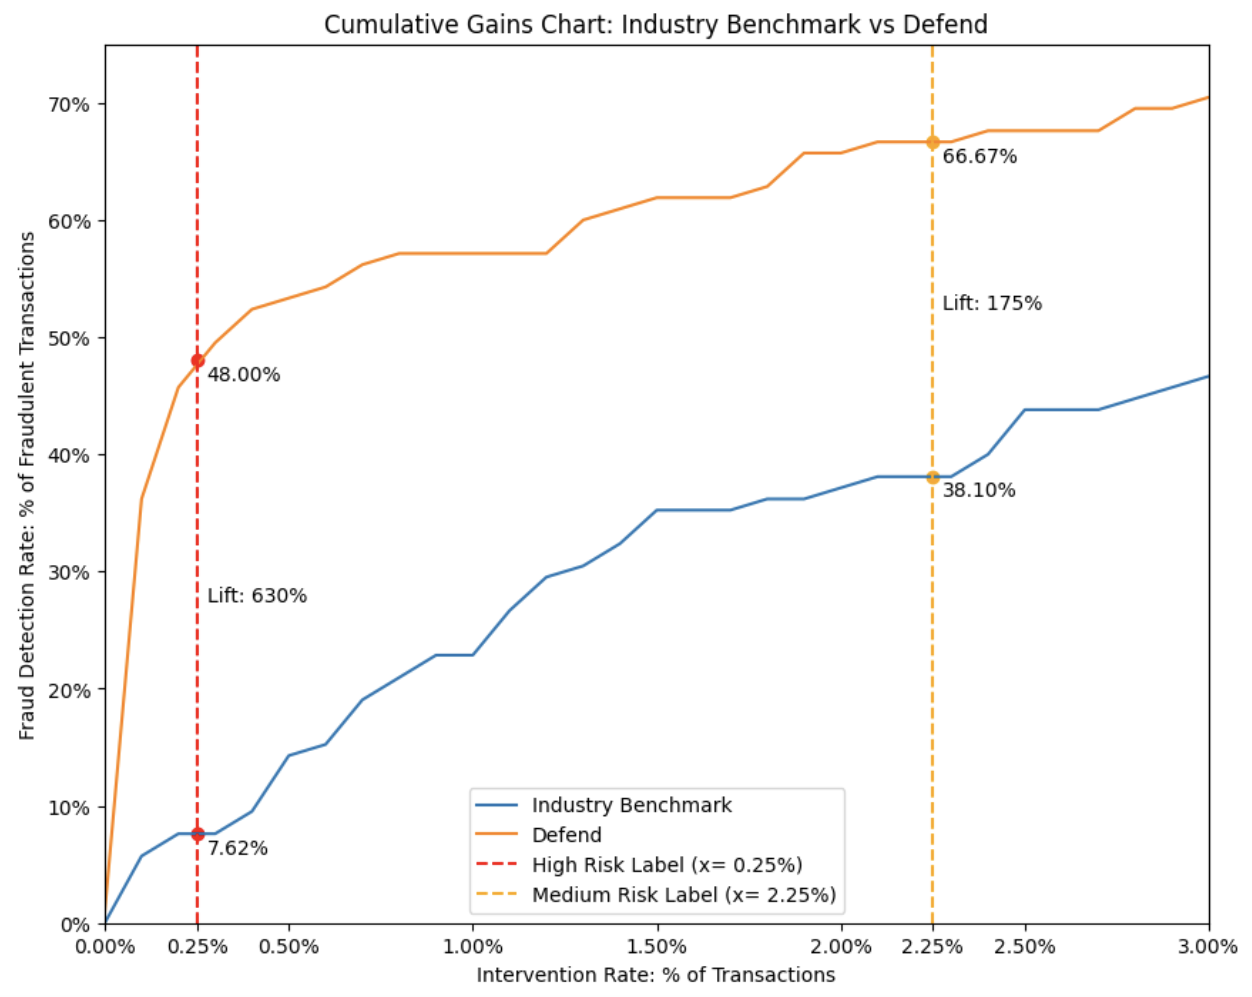
Defend Policy Evaluation Table
After overlaying the Defend Risk Engine’s performance on the Cumulative Gains Chart, we find that it detects 48% of known fraudulent transactions at a 0.25% intervention rate and 67% at a 2.25% intervention rate.
When comparing the fraud detection “lift” between the Defend Risk Engine and the industry benchmark model, the Defend Risk Engine detected 630% more fraudulent transactions at the “High” risk threshold and 175% more at the “Medium” risk threshold. In practical terms, this means the Defend Risk Engine can identify up to six times more fraud than a leading industry benchmark model when operating at equivalent intervention rates.
Furthermore, at a 2.25% intervention rate, the Defend Risk Engine reduced undetected fraud to under 1 basis point (BPS), representing a significant improvement in overall fraud mitigation.
C. Efficiency lift
Now let’s shift gears and focus on efficiency. We assessed how much the intervention rate could be reduced using our model, while still achieving similar levels of fraud detection — a measure we refer to as “efficiency lift.”
To match the Defend Risk Engine’s recall of 48% of known fraudulent transactions at a 0.25% intervention rate (corresponding to the “High” risk label), the industry benchmark model would have needed to intervene on 3.35% of all transactions. This demonstrates that the Defend Risk Engine is more than 13 times more efficient compared to an industry-leading passive-signal fraud model.
Similarly, to achieve the Defend Risk Engine’s detection rate of 67% of known fraudulent transactions at a 2.25% intervention rate (“High” plus “Medium” risk labels), the industry benchmark model would have required an intervention rate of 8.7%. This translates to nearly a 4 times improvement in efficiency delivered by the Defend Risk Engine.
6. Real-World Impact
By combining passive and active signal analysis, robust human-in-the-loop review, and the collective telemetry of the Identity Authorization Network (IAN), Proof has substantially reduced undetected fraud while preserving the user experience, compared to industry-standard solutions.
"85% of buyers anticipate an increase in fraud rates over the next two years as a result of advances in GenAI, and 70% of buyers are planning to turn on passive signals to address growing fraud threats" - Liminal
Efficacy at practical intervention rates
The impact of these findings are not theoretical, but operationally valid at conservative intervention rates.
Less than 1 BPS (1 in 10,000) of undetected fraud at a 2.25% intervention rate: In Proof's year-long simulation, monitoring just 2.25% of all transactions (those flagged as “High” or “Medium” risk by the Defend Risk Engine) enables Proof to drive undetected fraud rates below 1 BPS — a nearly 2x improvement over leading industry competitors by detection performance, and a nearly 4x improvement by intervention efficiency.
Critical value for high-value transactions
Significantly lowering undetected fraud to below one BPS has a profound impact on reducing the risk of substantial financial losses. This risk reduction is especially critical in high-value scenarios, such as digital real-estate closings, where a single undetected fraud event can result in losing hundreds of thousands of dollars. The same is true for other sensitive processes like bank account openings, mortgage applications, educational financial aid disbursements, and various regulated, large-value transactions, all of which benefit greatly from a robust fraud prevention strategy.
Minimal tradeoff: customer experience is preserved
Our approach to advanced fraud control delivers superior security without compromising the user experience — a common concern when adopting stronger defenses. Proof’s internal data shows that user completion rates remain above 90%, and net promoter score (NPS) consistently averages between 70 and 80 out of 100, with a stable 5% response rate each month. The verification process is also efficient, with typical time-to-completion averaging just 13 minutes for non-meeting transactions and 17 minutes for those requiring a meeting. These results confirm that even with increased fraud controls, Proof maintains a seamless and convenient experience for users. An experience that outperforms the hassle of waiting for customer support or attending in-person identity verification sessions, and meets or exceeds industry standards for digital experiences.
Industry transformation and network health
By reducing undetected fraud and maintaining an exceptional user experience, Proof provides meaningful risk reduction for individual organizations and confers broader benefits across the entire digital ecosystem. Participation in the Identity Authorization Network (IAN) creates a network effect, in which confirmed fraud that’s detected in one area quickly propagates throughout the network and helps protect other members, thereby reducing opportunities for cross-domain fraud to proliferate. Proof’s use of difficult to impersonate identifiers such as biometrics and government documents, fortifies the strength of our network compared to competitors who rely on spoofable information such as email addresses, phone numbers, and digital devices. As high-value transactions become increasingly digital, Proof demonstrates that it is possible to achieve both rigorous fraud minimization and an outstanding user experience. In doing so, Proof seeks to raise the industry standard and expectations for what modern fraud prevention solutions can and should deliver.
- Microsoft. “How effective is multifactor authentication at deterring cyberattacks?” Microsoft, https://cdn-dynmedia-1.microsoft.com/is/content/microsoftcorp/microsoft/final/en-us/microsoft-brand/documents/MFA-Microsoft-Research-Paper-update.pdf. Accessed 25 November 2025.
- Keepnet. “Understanding MFA Phishing: Protection Measures and Key Statistics.” Understanding MFA Phishing: Protection Measures and Key Statistics, 2024, https://keepnetlabs.com/blog/understanding-mfa-phishing-protection-measures-and-key-statistics. Accessed 25 November 2025
- Google. “Making you safer with 2SV.” Making you safer with 2SV, 2022, https://blog.google/technology/safety-security/reducing-account-hijacking/. Accessed 25 November 2025.


.jpg)


.png)